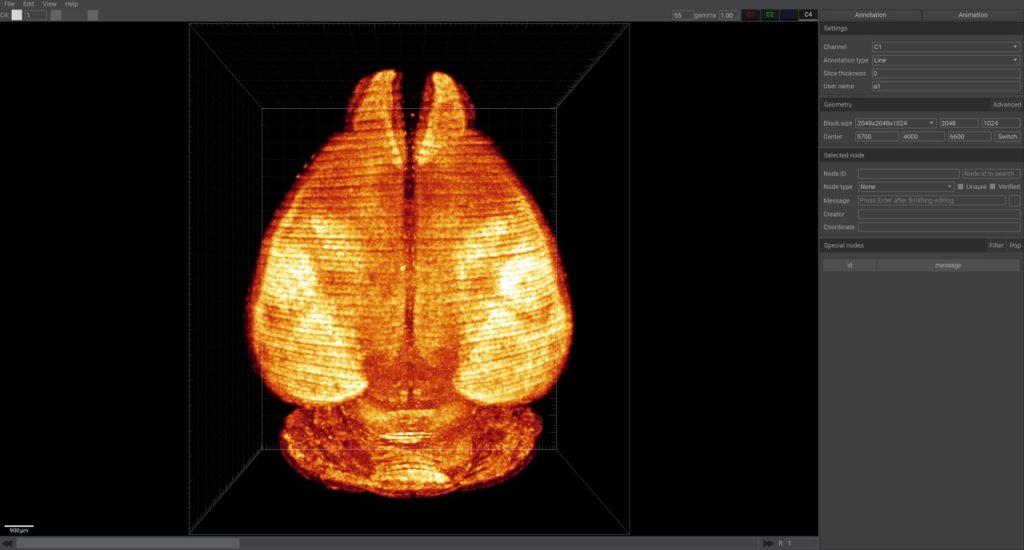
Lychnis-viewer is free software specifically designed for large-scale 3D/4D image data, primarily used for annotation and visualization of biological images such as neuron tracing. It supports multi-resolution data display, efficiently handles TB-level Imaris IMS files, and provides a complete toolset to help researchers perform precise structural analysis and reconstruction.
This software is the free version of the VISoR-Suite (Shenzhen Bineogen Technology Co., Ltd.) package for 3D/4D image annotation and visualization.
Supported Data Formats: Imaris IMS
Project File: JSON-based .lyp files (default) and binary .lyp2 files.
Running Lychnis software requires:
- Windows 10 System
- NVIDIA discrete graphics card
- If the software crashes on opening, you need toUpdate Graphics Card Driver
Save and Load
Image Import:
You can drag Imaris IMS files to the icon or main interface, or use the "File" -> "Open Image File" menu to load images.“File” -> “Open Image File”Load Image from Menu。
Save Project File:
Using Keyboard Shortcuts “Ctrl+S” or through“File” -> “Save Project”menu to save the project. Project files are in lyp format (based on JSON) or lyp2 format (optimized binary format)。
Load Project File:
You can drag lyp or lyp2 format project files to the icon or main interface, or through“File” -> “Load Project”Load Project File from Menu。
Software Interface
Resolution slider:
The resolution slider controls the display level of the current data. Adjusting it to the left reduces the number of levels, decreases the voxel width, and narrows the data view. Adjusting it to the right expands the field of view but may cause the display to become blurry. Information about all levels of the current data can be found in the menu:“File” -> “Display Image Information”,including pixel count and zoom ratio for each level。
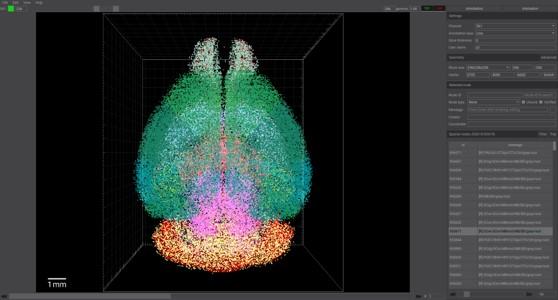
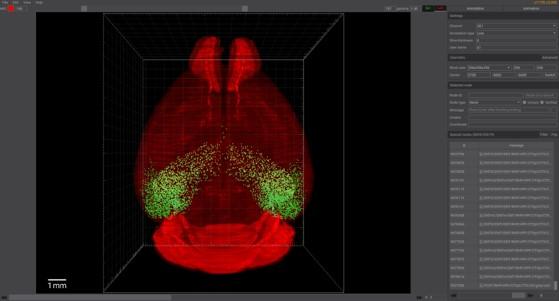
Channel Slider:
The channel slider manages the display parameters of various imaging channel data, including display range, color (supports LUT), and visibility settings. On the right are buttons to switch the channel control page. Left-click to switch channels, right-click to control their visibility.
This software currently supports data from ImageJ/Fiji and Imaris Viewer LUT (Lookup Table) files.
By default, the annotation page is displayed on the right (there is also a video production page that can be switched through the button in the upper right corner), including annotation settings, regional settings, information of selected nodes, and a list of nodes with messages.
Annotation Settings
- Channel: Specify the target channel for current annotation.
- Annotation Type: Including lines, points, and moving selected nodes. The difference lies in how new nodes are added during continuous annotation: whether they connect to the previous point, exist independently, or move the previously selected point.
- Slice Thickness: The thickness of slices, usually kept at 0, and related to specific imaging equipment.
- Username: Username of the annotator, recorded in each node, used to distinguish nodes annotated by different users. Each annotated node also records the username and computer name (hashed for distinguishing different computers).
Regional Settings
- Advanced Button (upper right corner): Displays the overall voxel width and position of the data, in micrometers.
- Block Size: Displays the size of the data block, with parameters for the number of XY pixels and Z-direction pixels. Provides custom setting options, allowing manual modification of parameters.
- Center: Displays the center of the data block, initially shown as three input boxes, which can be controlled by the scroll wheel. Clicking the "Toggle" button converts it to a single input box (requires pressing Enter to apply), facilitating the copying and pasting of information.
Node Information
- Node ID: Identifier of the selected node, with a search bar on the right to find the node by entering the ID and pressing Enter.
- Node Type: Including preset node types, uncertain status, and confirmed status.
- Message: Additional custom information for the node, press Enter to confirm. The color button on the right controls the color of the selected line.
- Creator: Node Creator.
- Coordinates: Node Coordinates (in microns).
The lower right corner of the software shows a list of all nodes with messages:Nodes with added information will appear in this list and can be filtered using the filter button in the upper right corner.
Main Interface Operations
Display Controls
- Rotation: Left-click and drag mouse.
- Pan: Right-click and drag mouse, or left-click while holding Shift key.
- Zoom: Scroll the mouse wheel or press and hold the wheel and move the mouse.
- Press the R key to quickly switch between the loaded data block (first press) and the entire dataset (subsequent presses), while Ctrl+R can reset the view.
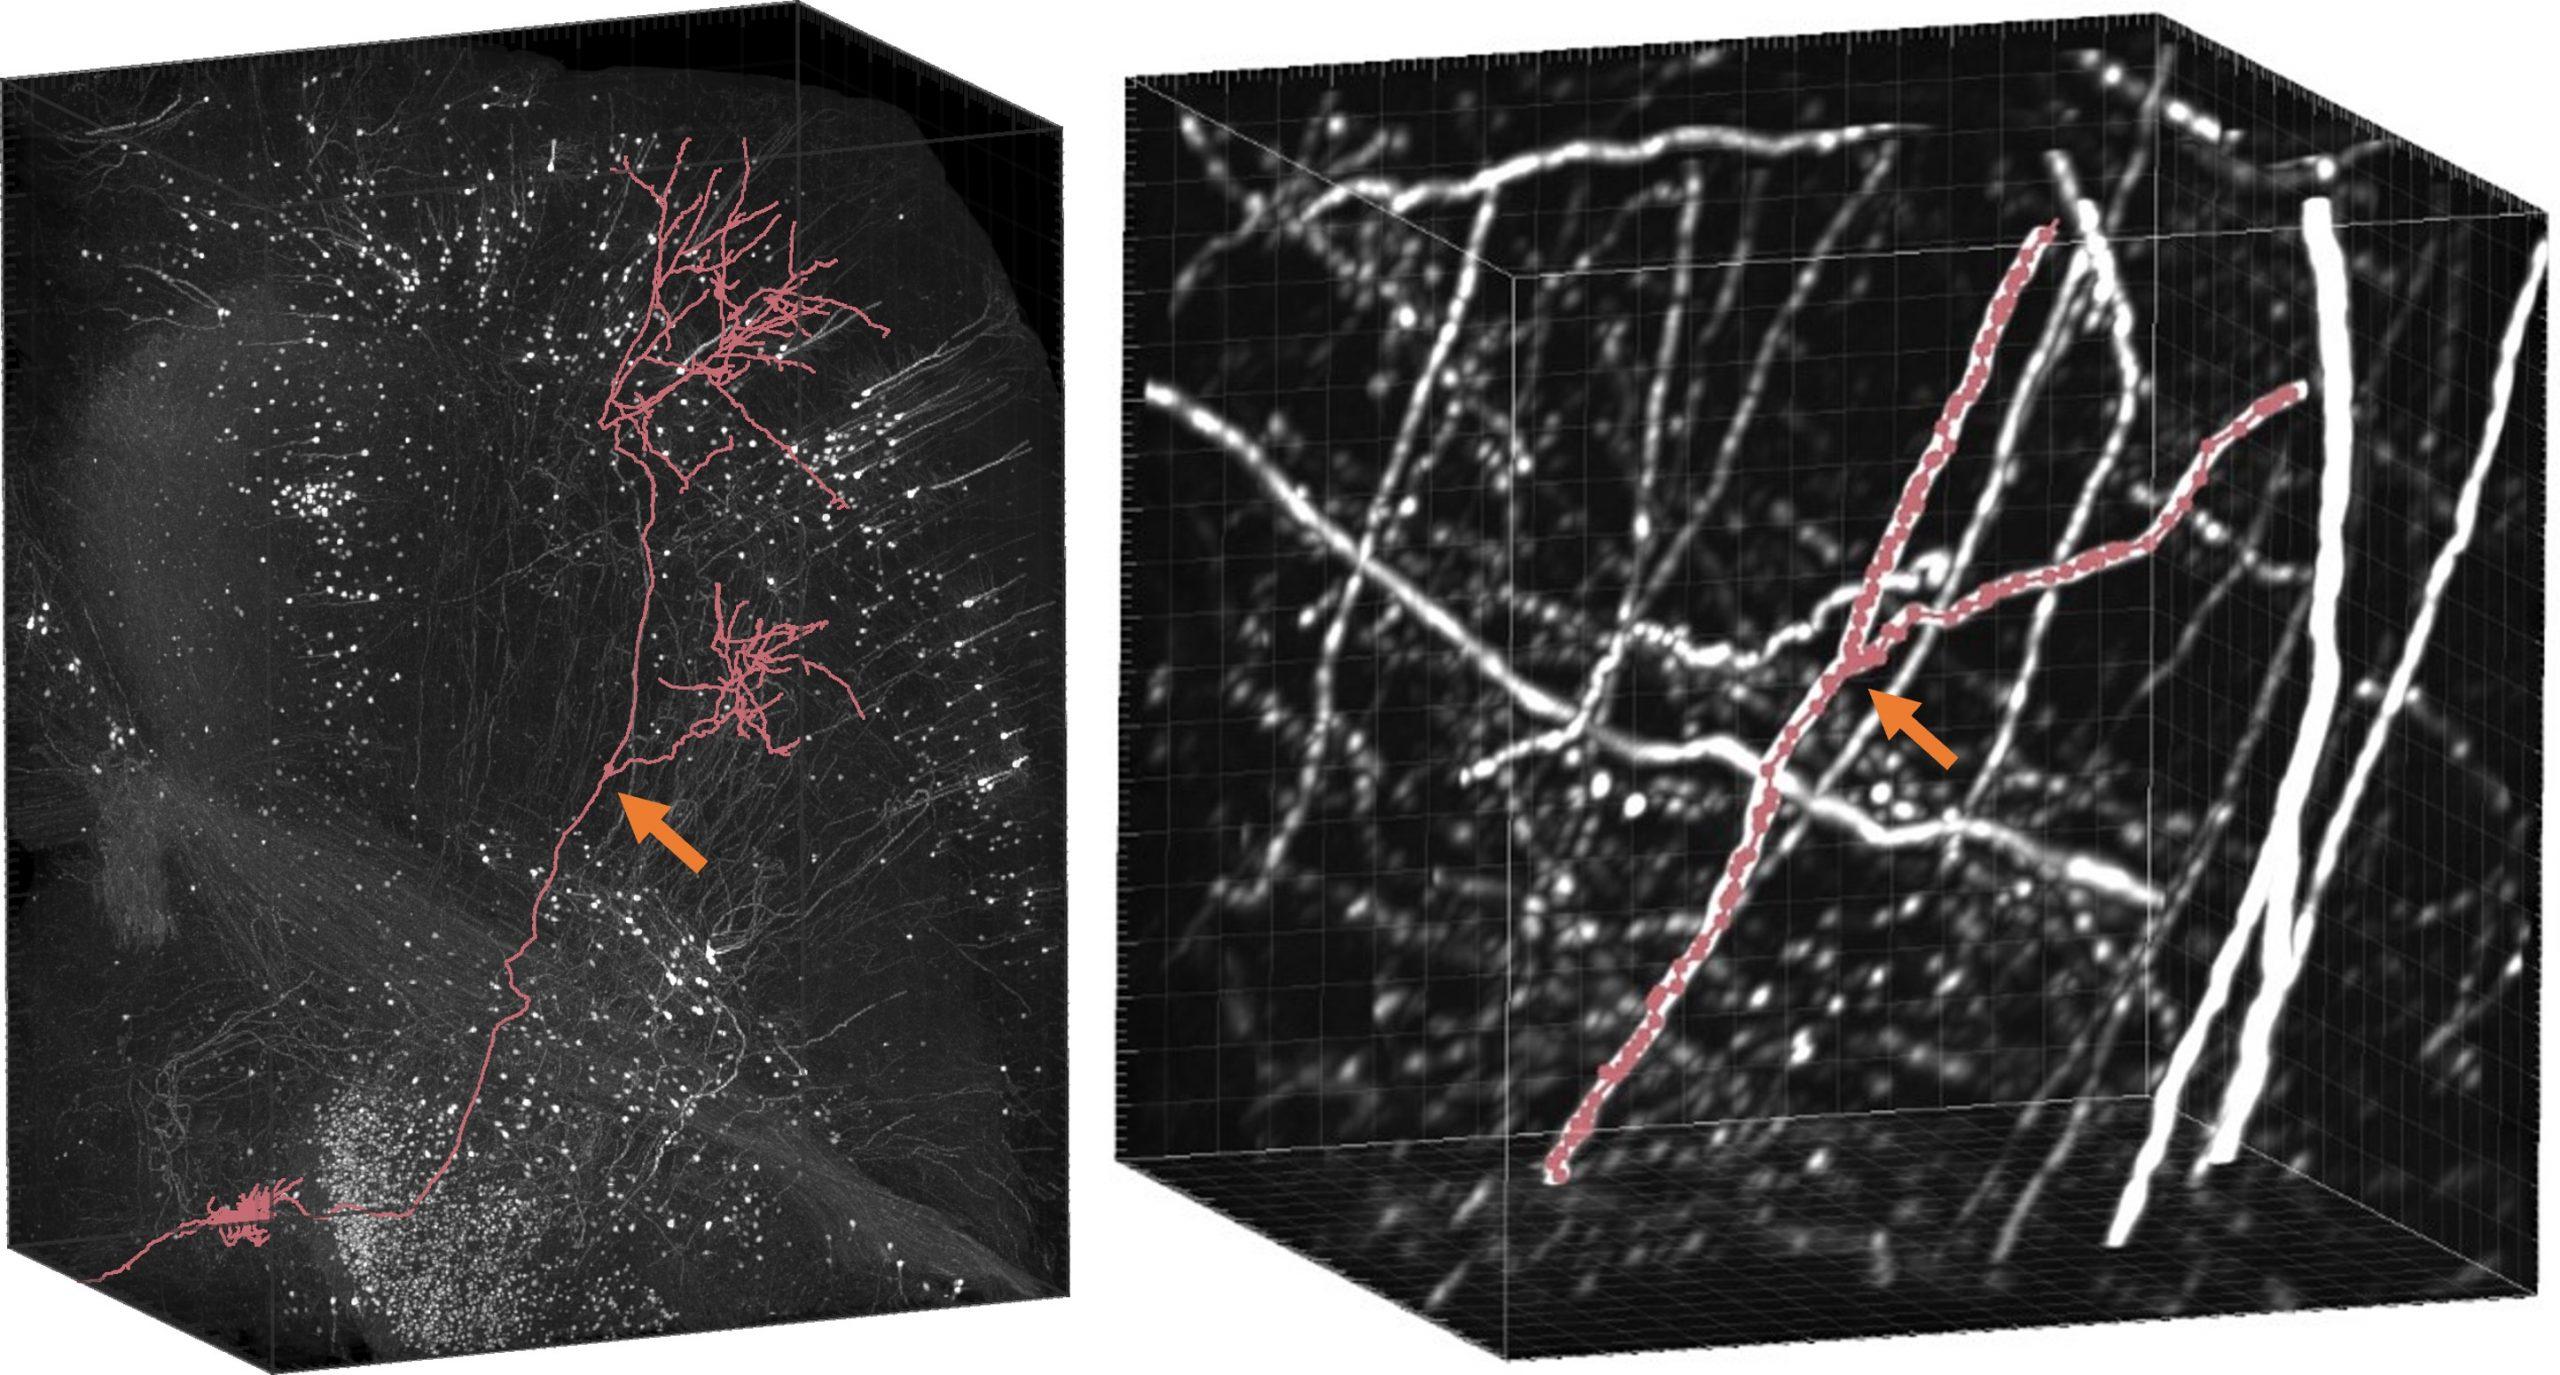
Annotation
- Add Annotation Point:While holding the z key, left-click the mouse
- Select Node: While holding the x key, move the mouse and left-click to select
- Connect Nodes: First select a node, then hold down the x key, move the mouse, and right-click when the target point is enlarged (middle-click will delete this segment of nodes)
- Node Visibility: Press the V key (or Alt+1) to toggle node visibility. After selecting a node, press Alt+2 to toggle the visibility of unselected lines.
- Delete Node: Press the Delete key to delete nodes.
- Automatic Fiber Extension Function: If a fiber segment containing at least two points is selected, pressing F key can automatically extend it.
Menu
-
File
- Import Nodes: Import software project files or node files in SWC format.
- Export Nodes to File: Export node files, supporting SWC format.
- Export Volume: Export images (based on current display level and channel).
-
Edit
- Construct node groups: generate node groups based on connectivity.
- Move to Pending Node: In Lychnis, nodes marked as "Cannot Continue Tracing Node" or "Terminal" are considered endpoints. Click this button to switch to unfinished annotation points, including incomplete terminal points and nodes marked as "#Branch node" but without branches, to assist in completing neuron annotation.
-
View
- Display settings: various display control options, such as the position and size of the scale bar.
- Show/Hide Slice: Display or hide the slice view, can also be toggled by Ctrl+double left-click.
Keyboard Shortcuts List
| Keyboard Shortcuts | Features |
|---|---|
Ctrl + S |
Save Project |
Shift + Left Button Drag |
Pan View |
R |
Switch View Between Current Data Block and Complete Dataset |
Ctrl + R |
Reset View |
V or Alt + 1
|
Toggle Visibility of All Nodes |
Alt + 2 |
Toggle Visibility of Unselected Lines (requires selecting a node first) |
Delete |
Delete Selected Node |
F |
Automatic Fiber Extension (Select Fiber Segment Required) |
Ctrl + Double-click Left Button |
Show/Hide Slice View |
Z + Left-click |
Add Annotation Point |
X + Move Mouse + Left-click |
Select Node |
After selecting a node, X + Move Mouse + Right-click Target Node |
Connect Two Nodes |
After selecting a node, X + Move Mouse + Middle-click Target Node |
Delete Connection Between Two Nodes |